Adobe Simulation
Allocating Budget and Measuring Success
Adobe’s Customer Journey
With the nuances of budget allocation and customer lifetime value (LTV) under your belt, it’s now time for you to tackle a simulation to test your knowledge.
Let’s begin by introducing the case that you’ll be examining as part of this simulation.
You will now have the chance to apply what you have learned throughout the articles by working through a capstone simulation. The material you have learned about attribution, budget allocation, and LTV will be directly applicable. But in addition, the topics we covered previously about marketing plans, customer acquisition, and engagement will also be relevant.
Use this as an opportunity to draw on what you have learned and test the skills you have developed.
For the simulation, you will be working through a case on Adobe, a company known for its popular software such as Acrobat, Photoshop, and Illustrator. In 2013, Adobe switched from selling software in a box as a one-time purchase to a cloud-based subscription model in which customers would pay monthly for access to its software. This change provided the firm with more regular revenue and a wealth of new customer data. But it also required a shift in its internal operations.
Adobe decided to refocus its organization around the customer journey and developed the model for doing so that it dubbed the Data-Driven Operating Model, or DDOM. This data-driven operating model unified siloed teams at Adobe under one system focused around one set of KPIs anchored in the customer journey.
The exercise you are about to complete will simulate the use of Adobe's data-driven operating model. The simulation will present you with two years of data from Adobe, one quarter at a time. Your task will be to allocate the company's budget across five stages of the customer journey to maximize annual recurring revenue, which is the revenue that Adobe gets from its customers every year they subscribe to its products.
Before starting the simulation, we will learn more about DDOM and Adobe's story from Adobe's executives.
Shantanu Narayen, CEO of Adobe, explains what went into the decision to shift from selling packaged software to a subscription model.
Adobe's mission has always been about changing the world through digital experiences. At our core, we're a product company. Our focus is really on innovating on behalf of an increasingly large number of customers.
The company was founded when John Warnock and Chuck Geschke, our cofounders, came up with the idea for PostScript, which is a language that enables people to print what they see on a screen. It was the genesis of the desktop publishing revolution. Subsequently, Adobe has pioneered in many new areas, including imaging with Photoshop, electronic document sharing with PDF, and more recently, enterprise software addressing the needs of digital marketers and businesses engaging with customers digitally. As a result, we're one of the largest and most diversified software companies in the world.
Adobe has always believed that in technology, especially in software, there is an S-curve. If you're not constantly reinventing yourself, thinking about disruptive areas that are emerging, or capitalizing on new tectonic shifts, then you won't thrive as a company.
In the late '90s, we saw people moving to the cloud, mobile becoming a primary way to both consume and create content, and the emergence of artificial intelligence and machine learning. This prompted us to rethink how we serve customers—delivering software in a more rapid, ubiquitous way and introducing a new business model that would appeal to a much broader set of customers.
The confluence of an economic recession, new shifts in software, and the opportunity to grow even larger led us to move our business model and product development methodology from delivering software once every 12 or 18 months to introducing software on a far more regular basis through a subscription model. That was the genesis of our transformation.
However, we knew we had to be thoughtful and deliberate because existing customers would respond differently to this shift compared to new customers.
Shantanu noted that Adobe would need to be thoughtful and deliberate about the decision to switch from one-time purchase, packaged software to a subscription-based business model.
- How might this change excite customers?
- Up-to-date software
- What about it may concern customers?
- Higher cost
Ann Lewnes, CMO at Adobe, goes into more detail on the financial factors that inspired Adobe to change its model.
Back in 2011 and 2012, Adobe's business had somewhat flatlined. We were very profitable, but not growing in terms of revenue at the pace we wanted. We observed a couple of key issues.
First, we could only ship a product after about two years due to our product life cycle. Engineers were constantly working on new features and applications for our creative and document businesses, but they couldn’t release them because the life cycle for packaged software at that time was about 18 to 24 months.
Additionally, we noticed that the financial community was rewarding companies with recurring revenue models. At Adobe, we were taking revenue up front—every time we sold a box of Photoshop, for example, we would charge the customer the full price immediately. This created peaks and valleys in our revenue. Every time we launched a new version, we saw a surge in revenue, but then sales would decline until the next release.
We wanted to transition to a recurring revenue model that provided more predictable success. When we decided to shift our creative business from packaged software to a full-scale subscription service—where customers paid monthly instead of upfront—we were initially focused on creating stability. However, what happened next surprised us.
At the same time we moved to subscriptions, there was a creativity explosion and a digital document explosion. While we expected recurring revenue and some growth in new customers, demand for our product surged. One major factor was affordability. Instead of paying $500 upfront, customers could now access Adobe software for $19.99 per month, making it much more accessible. This brought in a huge number of new customers.
This demand explosion significantly increased our customer base. It turned out to be a fantastic outcome for everyone involved. Engineers were thrilled because they could continuously ship new features instead of waiting for a major release. Customers were happy because they got access to the latest technology as soon as it was developed, while also benefiting from a more manageable payment model. Ultimately, the shift to subscriptions became a win-win scenario for both Adobe and its users.
Ann highlights how switching to a subscription model allowed Adobe to collect valuable customer data, but the company lacked a consistent method for analyzing and implementing the new approach. Each department was collecting its own data, and an understanding of the customer journey was siloed in departments. No one had a comprehensive view; departments were operating towards their own independent KPIs (key performance indicators).
These issues led Adobe to streamline its operations around what it calls the “Data Driven Operating Model” or DDOM.
One of the great advantages of moving to a digital subscription model was the ability to collect vast amounts of data, as all transactions were happening online. This allowed us to observe customer behavior in real-time and gain valuable insights.
However, the challenge was that every department was collecting its own data independently. The finance team gathered revenue data, marketing tracked web behavior, and sales focused on transactional records. As a result, while we had a wealth of data, it was highly siloed and disconnected across departments.
To address this, we developed the Data-Driven Operating Model (DDOM), which aimed to seamlessly integrate all customer data into a single source of truth. This required building a platform that could unify different types of data into a cohesive flow.
The key innovation in DDOM was structuring responsibility for data collection and analysis. Instead of every team working in isolation, we established clear ownership over specific parts of the data, ensuring consistency and alignment across the organization. This transformation allowed us to leverage data more effectively, make better business decisions, and improve the overall customer experience.
Maninder Sawhney, Vice President of Digital Media, Digital Go-to-market, and Sales, explains how DDOM used Adobe’s version of the customer journey to anchor a comprehensive operating system which connected different departments through shared KPIs.
With the Data-Driven Operating Model (DDOM), everything is anchored to a customer journey-based framework. We are not the first or the only company in the world to use a customer journey framework—this is a widely recognized approach that helps companies understand how customers engage with them.
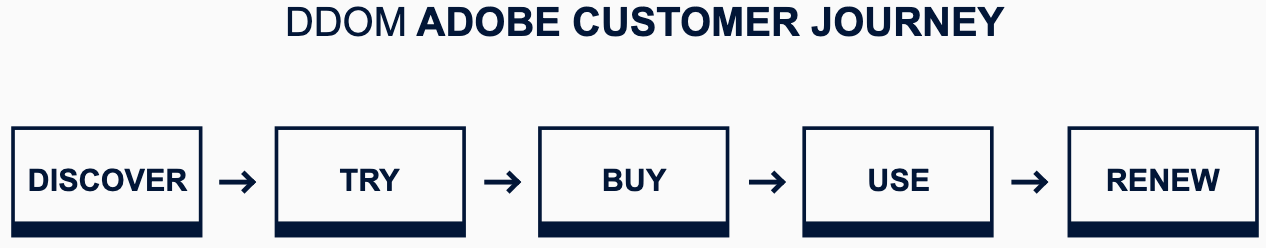
We identified five key stages in the customer journey, a process that dates back to 2016–2017:
- Awareness & Discovery – How do we find potential customers and drive awareness of our brand and products? How do we inspire them to explore how our products can fit into their lives?
- Try – In 2016, product trials were a key mechanism for customers to experience Adobe products and understand the value proposition before making a purchase.
- Buy – The stage where customers make a decision to purchase and begin their journey as an Adobe user.
- Use & Engagement – This phase focuses on ensuring customers actively use our product, maximizing their experience and value.
- Renew – Maintaining an ongoing relationship with Adobe through subscription renewals, ensuring long-term customer retention.
For each of these stages, there are various key metrics that allow us to assess the health of the customer journey. These insights can be measured at different levels—individual customer, cohort-based analysis, or an aggregated snapshot of the entire customer base.
By systematically tracking these stages, we can continuously refine our approach and ensure we are delivering the best possible experience to our customers.
Below are the five stages of Adobe’s customer journey that Maninder and his team identified:
Maninder identified several levels at which you can analyze customer data:
- At the level of individual customers
- At the level of a customer cohort, in other words, a specific group or subset of customers acquired at the same time
- At an aggregated level of the entire customer base
Adobe decided to start at an aggregate snapshot level because the complexity increases significantly if analysis is done at an individual or a cohort level.
As the DDOM model evolves, Adobe might eventually move to more fine-grained analysis at the cohort level and eventually at an individual customer level.
Maninder covers a few important KPIs that Adobe uses to monitor its customer journey framework at a high level through its data-driven operating model. We will go over the specific KPIs you will track in the simulation before you begin.
To evolve within this customer journey framework, we started by understanding it at a snapshot level. We needed to establish a rhythm around the numbers and metrics associated with each stage.
For every stage of the customer journey, we identified key KPIs to monitor business health. This process began by selecting available or instrumented metrics, tracking them, and analyzing how they correlated or causally influenced different stages. From there, we continuously adapted our approach.
These KPIs are not static. They evolve as we learn, adapt, and refine our methods. Here are some of the key metrics we use at different stages:
- Discover Phase – Initially, we tracked visits, but we have since refined this to focus on engaged visits—traffic that is meaningful rather than just users who bounce.
- Try Phase – We monitor trial signups, a key indicator of customer interest.
- Buy Phase – Our primary metric is conversion rate on the website.
- Use Phase – We track Monthly Active Users (MAO) to measure product engagement.
- Renew Phase – We focus on retention rates, ensuring long-term customer loyalty.
These are the high-level, or L1, KPIs. However, for actionable insights, we go much deeper with more granular data. Teams use these detailed metrics to run experiments, optimize processes, and evaluate whether primary KPIs are improving.
Since business dynamics constantly change, these metrics are not hard-coded. As we evolve, we update them to reflect our latest understanding of the customer journey.
Allocating Budget Across the Customer Journey
As Ann and Maninder have described, Adobe's transition to a subscription model and the implementation of DDOM provided an extensive data set. Adobe can now track customers throughout their entire journey and use this information to make strategic budget allocation decisions.
Decisions made at one stage of the customer journey can influence outcomes in another stage. For example, if the discover phase attracts a large volume of visitors to the website without considering quality, it could lead to low retention rates later in the renew phase.
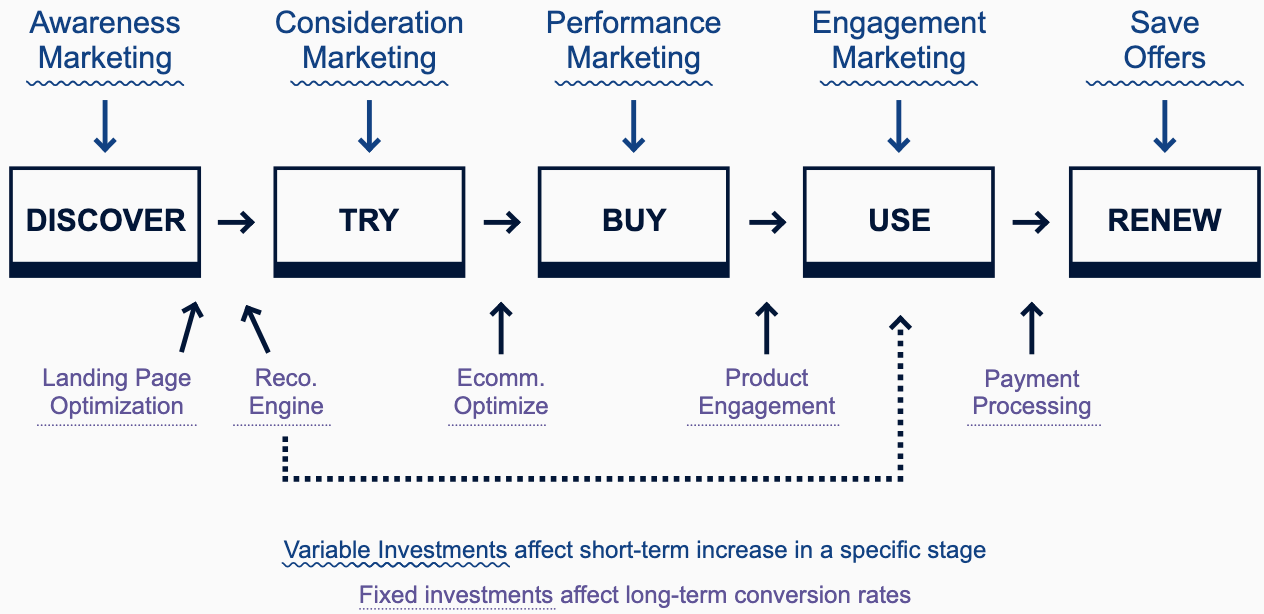
In this simulation, you will allocate Adobe’s budget across 10 variables and the five DDOM stages to help meet Adobe’s annualized recurring revenue (ARR) goals. The simulation spans eight quarters over two fiscal years.
You will manage two types of investments:
- Variable Spending – Has a short-term effect on KPIs but drops if spending is reduced.
- Fixed Investments – Long-term investments that increase conversion rates and impact future quarters, requiring sustained commitment.
Current Situation
Adobe just had a year of solid performance, delivering ~20% Net-New Annual Recurring Revenue (ARR) growth in our Creative Cloud business. Adobe’s CEO has set a goal of driving Creative Cloud Net-New ARR growth by 25% this year and next. To achieve that, we have a budget of $250M per quarter to spend in 2021 and $300M per quarter to spend in 2022. Your job is to allocate those resources across the five DDOM stages for each quarter. You’ll see that in 2021, the increase in budget is proportional to the increase in Net-New ARR target, but in 2022, the CEO has asked that you hit 25% Net-New ARR growth with only 20% growth in your budget. In addition, we want to exit Q4‘22 the same way you found the business in Q4 2020 with >135M website visitors (traffic), >12.7M trialists, >1.5M orders, and retention rate >70%.
The goals are in terms of Net-New ARR, which is defined as gross new ARR (new ARR from new customers sold in a specific period) minus the cancel ARR (ARR from customers that did not renew in a specific period).
| Year | Baseline 2020 | 2021 Targets | 2022 targets |
|---|---|---|---|
| Dedicated Budget Per Quarter | $200M (Actuals) | $250M | $300M |
| Budget Growth | - | 25% | 20% |
| Net-New ARR Target Per Quarter | $400M (Actuals) | $500M ($2B per year) | $625M ($2.5B per year) |
| Net-New ARR Growth | - | 25% | 25% |
| Exit Criteria for Simulation | - | - | By Q4 2022: > 135M Website Visitors >12.7M Trialists > 1.5M Orders Retention rate > 70% |
How the simulation works
- Starting with Q1 of the current year, you will be asked to allocate your budget across 10 variables and the 5 DDOM stages. You will also be asked to enter the hypothesis/rationale that led to your allocation decisions. As in real life, once submitted, you will not be able modify your budget allocation.
- Your objective is to reach or exceed the quarterly Net-New ARR target set by Adobe’s CEO in each quarter
- After submitting your inputs for a given quarter, you will receive a report that includes the results you have achieved for that quarter (in terms of Net-New ARR). The report also includes KPIs across all 5 stages of DDOM to inform investments for the next quarter. (You will be able to go back and see the reports from prior quarters).
- You will repeat this process for eight consecutive quarters and will receive a final consolidated report at the end of the simulation (which can be printed).
Product/Market Context
- Product Offering: The most sold offering in Creative Cloud is Creative Cloud All Apps (CCI) which is a bundled offering that includes Photoshop (creative imaging tool to edit photos, graphics etc.), Illustrator (vector editing tool for illustrations), Premiere Pro (professional video editing tools), Lightroom (photo editing tool), and many other applications and services. The customers range from creative professionals to enthusiasts, to students, and knowledge workers.
- Pricing: For the purposes of this simulation, the average pricing is ~$50/mo for the yearly plan (often paid annually).
- Market Assumptions: The total addressable market is large and the products included in CCI have already achieved product-market fit.
How we use our Data-Driven Operating Model (DDOM)
DDOM is an operating model that includes a dashboard of KPIs organized by the five phases of our customer journey (Discover, Try, Buy, Use, Renew). DDOM is a snapshot, showing these KPIs for all cohorts (existing customers and new customers) at a specific point in time. Most KPIs are leading indicators that help inform and optimize marketing, product spend to increase ARR. DDOM is the framework by which Adobe drives its ongoing business.
Phases of DDOM and Key Variables
Overall, there are two types of investments across DDOM: variable spend has a short-term effect on KPIs, but will drop if the spend is reduced. Fixed investments are longer-term investments that will raise conversion/retention rates across the five DDOM phases (they are often investments in headcount). Any fixed investment will have its impact in the next quarter and requires sustained investment to sustain that impact.
Discover
Invest in driving traffic to the Adobe.com website (KPI = # of visitors to website), some of which will convert to trialists/customers over time (some in existing quarters, some in later quarters).
- Awareness marketing (integrated brand campaigns, display, SEM, social)
Investing in channels and campaigns (such as search engine marketing (‘SEM’), social ads, tv ads) to generate awareness of product offerings and traffic to website (such as these Photoshop or this Premiere Pro TV ads, or social ads that say ‘learn more’ and direct to Adobe.com). Investment in this variable will lead to more visitors to the website in current quarter and some roll-over to the next quarter. At some point, the impact of additional spending in this area will yield diminishing returns, as it will take more money to find qualified traffic at scale.
- Landing page optimization & A/B testing
Fixed investment in headcount focused on optimizing landing pages, content, messaging and journeys on Adobe.com to send users to the right pages and to drive longer/multi-page visits. This will increase the conversion rate of website visitors to free trialists as they move through the funnel. Investment here will impact the following quarter.
Try
Invest in driving free trialists (KPI = # of free trials), some of whom will convert to customers (some in the existing quarter, some in later quarters). The total number of free trials is dependent on: the number of website visitors (from the Discover phase) x the conversion rate of visitor to trialist + new cohort of trialists from consideration marketing.
- Consideration marketing for trial (email, social, display)
Investment in variable marketing to reach new cohorts that were already aware of Adobe at some point and drive them to sign up for a free product trial. This includes social or display ads that focus on “try Creative Cloud for free for 7 days!” or call to action buttons that say “start free trial” (instead of “learn more” like in the Discover phase). Investment here will directly lead to an increase in the number of trialists. At some point, as you increase spend here you may see the marginal number of trialists get smaller as it will take more money to find trialists at scale.
- Recommendation engine to match users with products
Fixed investment in headcount building machine learning models that predict which products are the best fit for each trialist, to drive more successful trials. This will increase the conversion rate of visitors to trialists but will have an impact in the following quarter.
Buy
Invest in converting trialists/traffic into orders and therefore ARR (Two KPIs = # of orders, Gross New ARR). The total number of orders is dependent on: the number of trialists (from Try phase) x the conversion rate of trialist to order + new cohort of orders from performance marketing + organic base of orders (e.g., people that just come and purchase without any marketing). Gross New ARR is calculated as the number of orders x the average revenue per user (which is $600 per year from $50 per month).
- Performance marketing (branded SEM, social media/display retargeting)
Variable performance marketing across channels focused on converting potential users (that already have been exposed to our brand) to customers (e.g., branded keywords on Google, social/display ads for “buy now” or “install now”). Investment here will directly lead to an increase in the number of orders. At some point, as you increase spend here you may see the number of marginal orders decrease as it will take relatively more spend to find orders at scale.
- eCommerce optimization
Fixed investment in headcount focused on optimizing payment methods, purchasing paths, and product merchandising on Adobe.com making it as frictionless as possible to purchase Creative Cloud. This will increase the conversion rate from Try to Buy and will have impact in the following quarter.
Use
Invest in increasing the usage rate and monthly active users (KPI = monthly active users or MAU). The total number of monthly active users reflects the entire current user base, including both new and existing users. We are assuming that if you do not use the product at least once a month, you are NOT likely to renew (and therefore will cancel).
- Engagement marketing (email, social, display)
Investment in variable marketing to engage and inspire the current user base (limited universe of people). For instance, this includes email campaigns that have inspiration content to encourage people to open the app, or social/display campaigns with tutorials. Spend here will drive increased usage, which will drive increased retention in the short term (but will drop if variable spend is decreased).
- Product engagement (tutorial content, first mile)
Fixed investment in headcount and content associated with inspiration and learning within the product and ecosystem. This includes tutorial content, or ‘first mile’ experience to improve ease of onboarding, product understanding and getting started/productive. This will increase engagement/usage at the cohort level, creating more loyal customers, and improving retention rate. This investment will impact the following quarter.
Renew
Invest to increase retention rate and drive Net-New ARR (Two KPIs = Retention Rate (%), Cancel ARR: the amount of ARR lost from customers that did not renew in that period). Renewal is automatic, so the focus is on avoiding cancellations. We assume here that each quarter, 25% of current users are up for renewal.
- Save offers
Variable spend on pricing offers to ‘save’ customers before they cancel (e.g., after a user clicks on ‘cancel subscription’, they might be offered a discounted price or a different product/pricing combination to encourage them to stay). The investment here includes data scientists to figure out the best offers, as well as the cost of executing email campaigns and product flows for these offers. Spend here will drive an increased retention rate in the short term (but will drop if variable spend is decreased). Because we are offering a discounted price, this will reduce the ARPU (average revenue per user) for the users that are ‘saved’. This will not only impact the users targeted by the save offers (those who would have cancelled), but also impacts a set of users that simply take advantage of the promotion to get a discounted rate (but who were not planning to cancel).
- Fixed investment in payment processing, bank relationships, local currency
Investment in headcount focused on making sure there are less cards rejected, more automatic annual billing, making sure recurring pricing is in local currency, etc to raise the retention rate. Investment in this variable will impact the following quarter.
KPIs
You will be able to track key KPIs across all phases of the customer journey in addition to Net-New ARR and a simple ROI metric ‘in quarter return per dollar’. These key KPIs are:
- Net-New ARR
- # of visitors to website (Discover KPI)
- # of free trials (Try KPI)
- # of orders (Buy KPI)
- Gross New ARR (Buy KPI)
- Monthly Active Users (Use KPI)
- Retention Rate - % of customers that renew annual contract (Renew KPI)
- Cancel ARR - amount of ARR lost from cancelled customers (Renew KPI)
- In Quarter ROI = Net-New ARR in quarter divided by the investment
Last year’s budget allocation
Last year we used the same budget allocation for each quarter. Below are the spending and investments we made across the DDOM stages and the resulting KPIs in Q4. You can use this baseline to inform how you might want to invest in 2021 and 2022.
| Investments | Q1 2020 | Q2 2020 | Q3 2020 | Q4 2020 |
|---|---|---|---|---|
| DISCOVER: Awareness Marketing | $40M (20%) | $40M (20%) | $40M (20%) | $40M (20%) |
| DISCOVER: Landing Page Optimization | $2M (1%) | $2M (1%) | $2M (1%) | $2M (1%) |
| TRY: Consideration Marketing for Trial | $30M (15%) | $30M (15%) | $30M (15%) | $30M (15%) |
| TRY: Recommendation Engine to Match User/Prod | $1M (0.5%) | $1M (0.5%) | $1M (0.5%) | $1M (0.5%) |
| Buy: Performance Marketing | $77M (38.5%) | $77M (38.5%) | $77M (38.5%) | $77M (38.5%) |
| Buy: eCommerce Optimization | $2M (1%) | $2M (1%) | $2M (1%) | $2M (1%) |
| USE: Engagement Marketing | $31M (15.5%) | $31M (15.5%) | $31M (15.5%) | $31M (15.5%) |
| USE: Product Engagement (tutorial, content etc.) | $2M (1%) | $2M (1%) | $2M (1%) | $2M (1%) |
| Renew: Save Offers | $15M (7.5%) | $15M (7.5%) | $15M (7.5%) | $15M (7.5%) |
| Renew: Fixed investment in Payments, Currency | $0M (0%) | $0M (0%) | $0M (0%) | $0M (0%) |
| Outcomes | Q1 2020 | Q2 2020 | Q3 2020 | Q4 2020 |
|---|---|---|---|---|
| Net-New ARR | $391M | $394M | $397M | $400M |
| DISCOVER: # of website visitors | 134M | 135M | 136M | 137M |
| TRY: # of free trial users | 12.3M | 12.45M | 12.6M | 12.75M |
| BUY: # of orders | 1.5M | 1.51M | 1.52M | 1.53M |
| BUY: Gross New ARR | $903M | $908M | $913M | $918M |
| USE: Monthly Active Users | 7.82M | 7.82M | 7.84M | 7.85M |
| Renew: Retention Rate | 70.57% | 70.57% | 70.57% | 70.57% |
| Renew: Cancel ARR | -$512M | -$514M | -$516M | -$518M |
| ROI: In Quarter Dollar Return | $1.955 | $1.97 | $1.985 | $2 |
Next, let’s review some of the key ideas around fixed and variable investments in the DDOM simulation.
The next step is to allocate variable investment across the five stages of the customer journey. We will use available data to identify problem areas and focus our spending accordingly.
Key Findings from Q4 2020 Data
- Adobe lost $518M in ARR from cancellations, more than its net new ARR of $400M.
- This signals a major churn problem that needs to be addressed.
- We must analyze why customers are canceling and how to prevent revenue leakage.
Possible Causes of Customer Cancellations
- Incorrect Product Purchases
- Novice users may be encouraged to buy an advanced version for short-term revenue, leading to frustration and eventual churn.
- Fix: Improve product recommendations at the buy stage.
- Payment Friction
- Simple issues like credit card declines or lack of automatic billing can drive cancellations.
- Fix: Increase fixed investment in payment processing at the renew stage.
- Low Product Engagement
- Customers who do not actively use the software are more likely to cancel.
- Fix: Increase engagement marketing and in-app tutorials at the use stage.
- Save Offers & Price Sensitivity
- Offering discounts at renewal can temporarily reduce churn but creates long-term price sensitivity.
- Fix: Instead of excessive discounting, invest in improving the product experience to increase retention naturally.
Focus on the Use Stage to Reduce Churn
- Adobe gains 1.5M new users per quarter, but the total user base remains the same.
- 25% of current users are up for renewal each quarter.
- If 1.5M users stop using the software per quarter, churn from disengaged users could cost $225M per quarter (43% of total ARR loss).
- Fix: Enhance product engagement through:
- Onboarding tutorials
- In-app education
- Proactive engagement campaigns
Balancing Growth vs. Retention
- Focusing only on retention ignores customer acquisition.
- Adobe’s growth depends on expanding the top of the funnel since its products (e.g., Photoshop) have limited competition.
- Discovery data issue: In Q4 2020, Adobe had only 137M website visitors—low for a global leader.
- Fix: Test different levels of awareness marketing to determine the most effective investment.
How to Determine the Right Investment Levels?
- The simulation, like real life, does not provide a clear answer.
- The best strategy is experimentation:
- Allocate funds to various customer journey stages.
- Monitor KPI changes over multiple quarters.
- Adjust spending dynamically based on performance.
In real-world scenarios, companies use econometric models or A/B testing to optimize budget allocation.
The simulation has made it clear that:
- Directing funds towards one part of the funnel has effects on other parts.
- Fixed and variable investments will pay off in different ways because they solve different problems.
- Understanding the root cause of a “leak” in your funnel will help your budget allocation decisions create the greatest impact on your bottom line.
- Not all aspects of the funnel will react the same way to additional funds; some will reach points of diminishing returns.
- Testing out different strategies and closely tracking their impact on your KPIs is the best way to maximize the impact of your budget allocation.
- There is no surefire formula for success; you must test and learn to understand the ins and outs of your particular product and your particular audience.
Maninder and Ann describe the factors that keep Adobe’s DDOM strategy in a constant state of evolution. Maninder lists three central factors that have affected where he and his team have allocated budget across DDOM in the past.
Marketing budget allocation in the digital media business is a highly sophisticated process. We leverage econometric models to determine the best investment strategy based on macro environment conditions, market demand, and predicted returns.
Three Core Inputs in Budget Allocation:
- Customer Journey Prioritization
- Investments are allocated based on expected return on investment (ROI) at different stages.
- As Adobe has shifted focus from transactions to engagement, models have evolved to prioritize usage and long-term customer experience.
- Strategic Priorities
- Investments are distributed based on customer segments, product lines, and strategic goals.
- Prioritization happens at the intersection of customer segments, product offerings, and customer journey stages.
- Overall Business Volume
- Budget allocation is proportional to the existing customer base and overall business value in each market segment.
Process Overview
- These three factors feed into predictive models, which simulate business outcomes based on different investment levels.
- Refinements are made through optimization campaigns, fine-tuning spending to maximize efficiency and impact.
DDOM: A Constantly Evolving Model
- Adobe’s Data-Driven Operating Model (DDOM) is always under construction.
- New insights emerge continuously, requiring new measurement strategies.
- One major area of focus now is retention.
Key Insight on Retention
- Customer retention depends on product usage.
- Adobe has identified high-value actions—specific product interactions that correlate with higher renewal rates.
- Understanding these high-value actions helps:
- Refine paid media targeting.
- Optimize engagement strategies.
- Enhance long-term retention efforts.
DDOM is a constant work in progress, but its core principles remain unchanged—data-driven decision-making, continuous optimization, and customer-focused engagement.
Quantitative and Qualitative Judgment
Maninder describes the challenges of managing data and automating DDOM.
The Growing Role of Data and Human Judgment
The volume of data being collected is exponentially increasing, reaching petabytes per hour. However, despite this vast amount of information, the role of human judgment remains critical in multiple ways.
The Role of Humans in Data-Driven Decision Making
- Interpreting Data Beyond Raw Numbers
- Data provides signals, but it can also generate false positives or false negatives.
- Practitioners must contextualize the data, identify meaningful patterns, and build a coherent narrative around the insights.
- Ensuring Empathy and Customer-Centric Thinking
- While machines optimize numbers, humans understand customer emotions and experiences.
- It’s crucial to align data insights with real-world customer behaviors to avoid purely mechanical decision-making.
- Designing Experiments and Campaigns
- Insights from data must be translated into actionable experiments.
- Human expertise is needed to develop hypotheses, test variables, and refine strategies based on real-world conditions.
Humans and Machines Must Evolve Together
- AI and machine learning will continue to enhance automation and predictive analytics.
- However, human adaptability must evolve in parallel, ensuring that customer experience remains at the center of every data-driven decision.
- The ultimate goal remains optimizing for the customer, ensuring data insights translate into real value for the end user.
Shantanu highlights the qualitative judgment necessary for directing DDOM’s constant evolution.
The Evolution of Adobe’s Data-Driven Operating Model
A Living, Evolving System
The Data-Driven Operating Model (DDOM) is not a static framework but a living organism that continuously adapts and evolves. Leaders like Ann Lewnes and Maninder Sawhney play crucial roles in refining and advancing this model to meet new challenges.
From Acquisition to Engagement
- Initial Focus on Acquisition
- When Adobe introduced the subscription model, the primary objective was customer acquisition.
- The company’s entire focus was on driving awareness and gaining new users, which was highly successful.
- Shifting Focus to Engagement & Retention
- As the subscription base grew, engagement and retention became the most important dimensions.
- Adobe realigned its entire company to prioritize engagement and retention.
- Incentive structures were revised so that all employees worked towards increasing engagement and retention rates.
The Next Step: Segmentation & Personalization
- Moving forward, Adobe is refining customer segmentation to better understand user needs.
- Different users have distinct needs, such as:
- Video Editors who require specialized tools.
- Illustrators who focus on graphic design.
- Casual Users who simply want to communicate ideas.
By categorizing users more effectively, Adobe aims to personalize engagement and provide more relevant experiences.
Success is Company-Wide Data Ownership
- A company is truly data-driven when every employee considers the data model as their own.
- Employees across all functions should understand their role in driving a specific slice of the data.
- This commitment to data ownership and refinement will be a constant initiative at Adobe.
Adobe’s ability to continually evolve its data-driven strategy is key to scaling and sustaining its subscription-based success.
The Power of Adobe’s Data-Driven Operating Model (DDOM)
A Unified System for Customer Insights
Adobe's Data-Driven Operating Model (DDOM) was developed to align key customer journey metrics across all departments. This innovation transformed Adobe’s business model by:
- Identifying the most critical metrics across the entire customer lifecycle.
- Connecting siloed data into one unified system.
- Fostering synergy between departments that handle different customer interactions.
Shifting Focus from Acquisition to Retention
- Initially, Adobe was product-focused, emphasizing customer acquisition.
- As customer insights deepened, priorities shifted to engagement and retention.
- This change led Adobe’s product teams to rethink how they design software to encourage frequent use.
By shifting from a product-centric approach to a customer-centric strategy, Adobe ensured that its tools drive continuous engagement and long-term customer loyalty.
Scaling DDOM for Clients
- Adobe’s success with DDOM highlighted its potential beyond internal use.
- The company now plans to productize DDOM, making it available to clients like Intuit and Peloton.
- This not only strengthens Adobe’s relationships with its clients but also expands its digital marketing and analytics business.
Through DDOM, Adobe has unlocked the power of unified customer data, transforming how businesses engage, retain, and grow their customer base.